Grai Matters: Looker 👀? I hardly know her.


It's Live
The BI layer is, somewhat ironically, one of the hardest components of the data stack for many data engineering teams to generate insight into. It's a user facing component often offering generic query capabilities straight to users who may not fully understand the underlying data model. Add to this, configuration is often GUI driven making it difficult to apply software engineering best practices like version control to the development process.
We discussed some of this in last months newsletter about Metabase but these problems generalize across BI tools (including Looker). The user facing attributes of BI tools make otherwise simple testing tasks like testing data migrations for dashboard impact frustratingly difficult. Grai is aiming to change that.
If you're a gcp user an alpha release of the Looker integration has already rolled out and should be available in the sources tab of your dashboard. Once you've connected Looker into Grai existing CI test tasks will automatically start validating changes against user dashboards so give it a shot.
Lineage Discoverability
Navigating within the lineage of a large data graph can be difficult particularly if you don't know exactly what you're looking for in advance. We are continuing to iterate on different avenues of improvement here but this month saw the rollout of two major features
Semantic Search
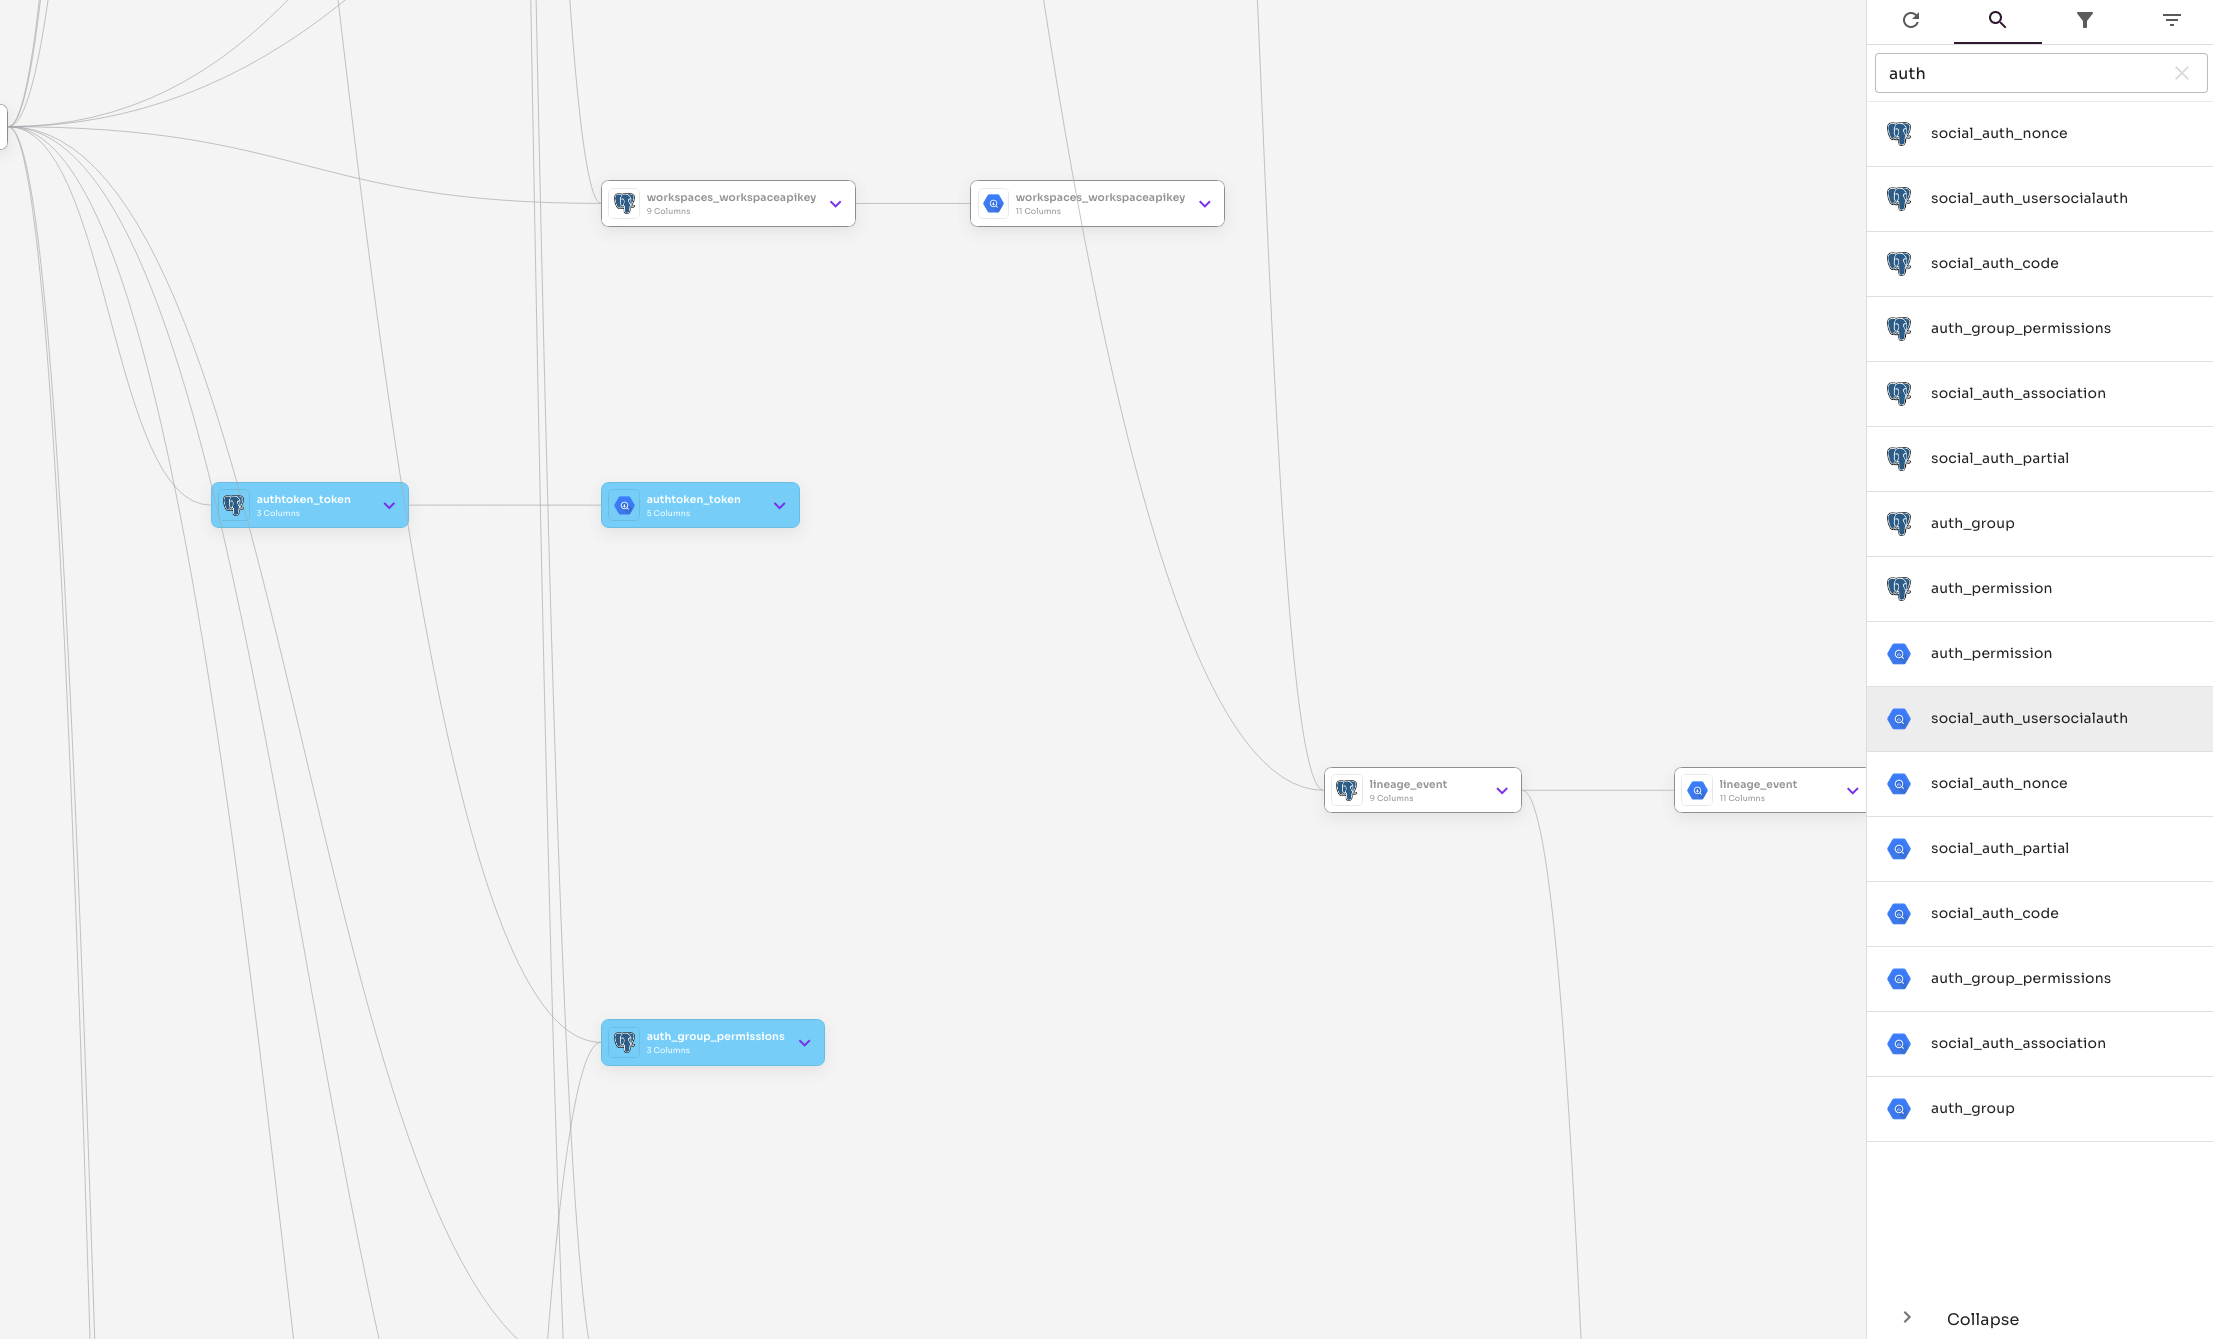
New search capabilities are targeted at improving navigation within large graphs. With it you'll be able to
- Perform partial / fuzzy searches over your entire lineage
- Visually identify search matched data within your graph
- Navigate throughout the graph by clicking on search results within the search panel
This will be an area of continued improvement as we begin indexing additional aspects of metadata into search results so stay tuned for future updates.
Source Graphs
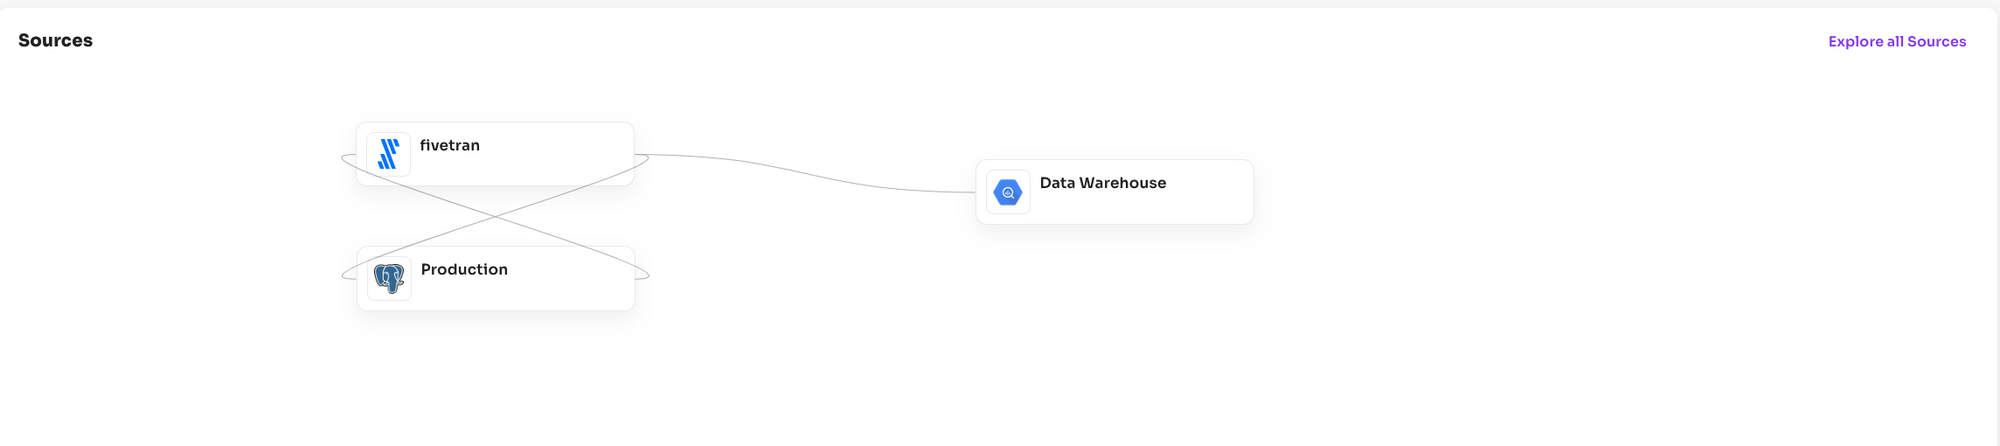
You'll find a new component on the Home page covering something we are calling the "Source Graph." Behind the scenese Grai understands the detailed, column level connections between every piece of data in your organization. However, sometimes what you need is a higher level abstraction identifying the high level relationships between data generators and consumers. For these purposes, the standard graph view is too granular, enter: "Source graphs."
Here we apply clustering algorithms to your underlying graph which identify the most representative data sources and their relationship to each other across your data stack. These are dynamically updated so as your graph changes and evolves you'll always have a high level view of it's constituent components and their relationship to each other.
Community Pages
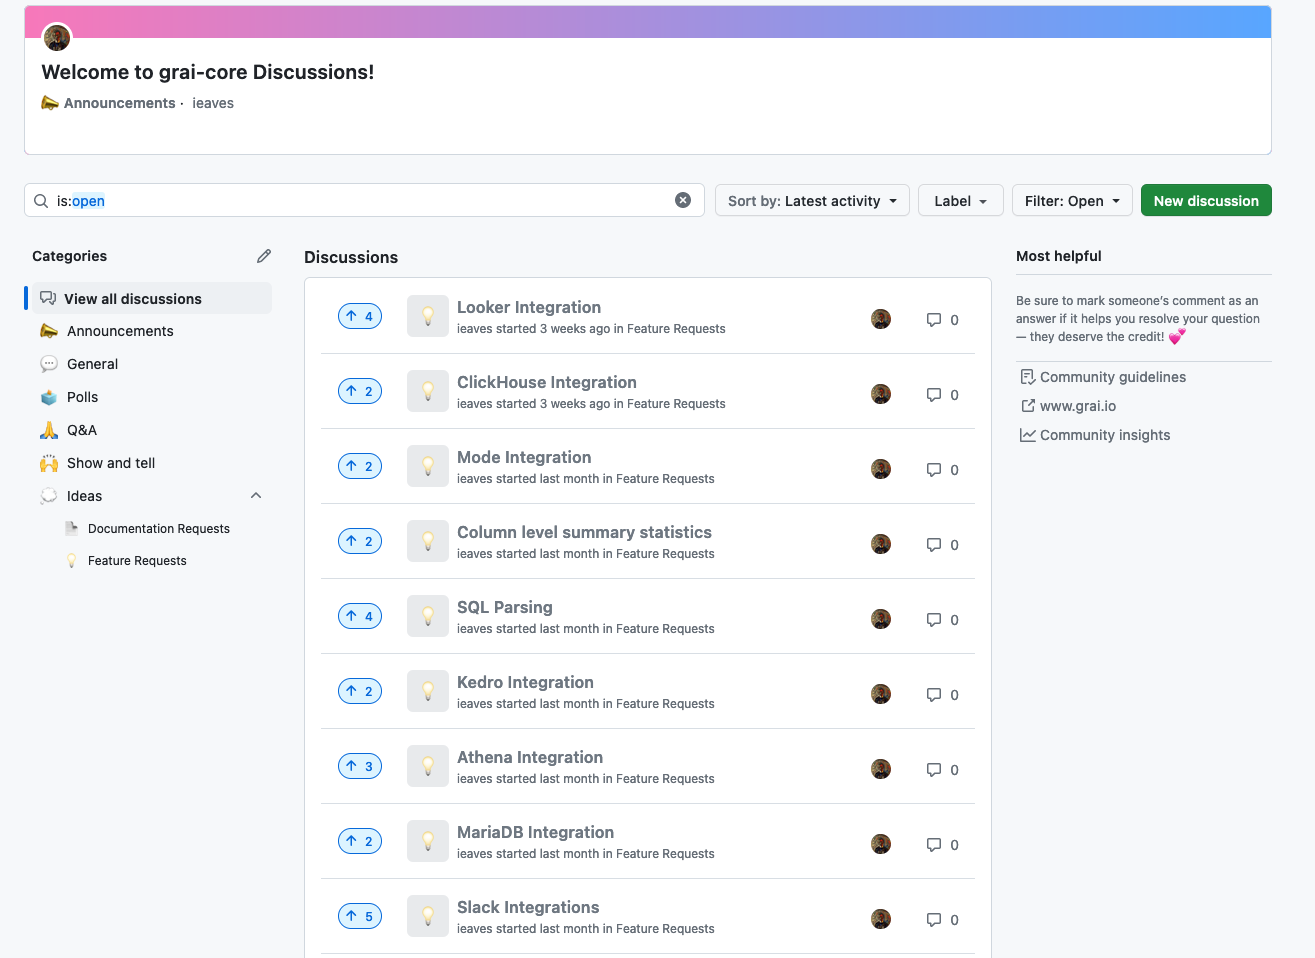
We've had a number of requests for a community roadmap and feature request page over the past few months. Although this may not be it's permanent home please check out the Discussions page on GitHub. We are beginning a transition to include a public roadmap, and to expose our internal ticket tracking in lineage back through to GitHub issues. In the meanwhile, we will use community feedback and votes to prioritize new features as needed and to answer community questions. Of course, we will remain available on Slack as well :).
Wrapping Up
That's it from us folks. Just remember though, if this is you:
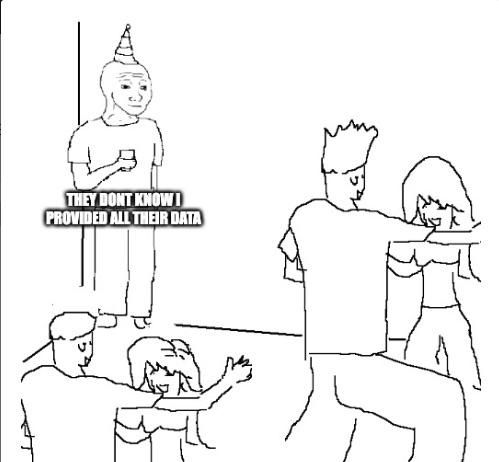
We see you <3.
~Ian & Edward